User Journey Maps
A User Journey Map describes the end-to-end experience of a customer or user
interacting with a service. kUML’s blueprint {} DSL captures this as a
type-safe model — versionable in Git, renderable as an SVG swimlane diagram,
and executable in CI.
The four-layer model
kUML follows the classic Service Blueprint structure with four horizontal layers separated by three dividing lines:
| Layer | What it contains |
|---|---|
Customer Actions |
Every touchpoint where the customer interacts with the service: search, click, fill in a form, receive an email, pick up a parcel. |
Frontstage |
All visible interactions between staff/system and the customer. This is what the customer can see: the web form, the chat bot reply, the confirmation screen. |
Backstage |
Behind-the-scenes work that the customer cannot see: fulfilment, manual review, account verification, fraud check. |
Support Processes |
Shared infrastructure and third-party services that underpin frontstage and backstage: payment gateway, CRM, email service provider, warehouse system. |
The three dividing lines are rendered as dashed horizontal rules in the SVG:
-
Line of Interaction — between Customer Actions and Frontstage.
-
Line of Visibility — between Frontstage and Backstage.
-
Line of Internal Interaction — between Backstage and Support Processes.
Sentiment
Each step carries an optional sentiment annotation that drives the colour of
that step’s node in the rendered diagram:
| Value | Colour (default theme) | Meaning |
|---|---|---|
|
Green |
Customer is delighted or relieved. |
|
Grey |
No strong emotional signal. |
|
Red |
Customer is frustrated, confused, or blocked. |
|
Amber |
Known friction: acknowledged but not yet eliminated. |
DSL reference
blueprint("…") {
    // Actors, channels and touchpoints are declared at the `blueprint { }` level
    // (DslMarker scope isolation forbids declaring them inside `phase { }`) and
    // referenced from steps by their id.
    val someActor = actor("…", ActorRole.STAFF)
    val someChannel = channel("…", ChannelKind.WEB)
    val someTouchpoint = touchpoint("…", channel = someChannel)

    phase("…") {                                   // swimlane column / phase heading
        customer("…", Sentiment.POSITIVE,          // Layer: Customer Actions
            touchpoints = listOf(someTouchpoint))
        frontstage("…", actor = someActor,          // Layer: Frontstage
            touchpoints = listOf(someTouchpoint))
        backstage("…", actor = someActor)           // Layer: Backstage
        support("…", actor = someActor)             // Layer: Support Processes
    }

    // phases are connected left-to-right in declaration order
    phase("…") { /* … */ }

    // renders all four layers + the three dividing lines; emotionCurve overlays
    // the Sentiment-driven curve described above
    blueprintDiagram("…", emotionCurve = true)
}
ChannelKind enum values: WEB, APP, PHONE, EMAIL, IN_PERSON, MAIL, SOCIAL, CHAT, OTHER.
ActorRole enum values: CUSTOMER, STAFF, SYSTEM, PARTNER.
Sentiment enum values: VERY_NEGATIVE, NEGATIVE, NEUTRAL, POSITIVE, VERY_POSITIVE.
CLI usage
# render to SVG (default)
kuml render membership-journey.kuml.kts

# render to PNG
kuml render membership-journey.kuml.kts --format png

# validate DSL structure only (no render)
kuml validate membership-journey.kuml.kts
Output: an SVG swimlane diagram with the four layers as horizontal bands, phases as vertical columns, Sentiment colour coding, and dashed dividing lines.
Example — PdV membership journey
The following example models the end-to-end experience of a citizen joining the
Partei der Vernunft (PdV), from first contact on social media through the
"valley of tears" waiting period to full engagement. It is the canonical
Service-Blueprint example used across the kUML documentation (vault source:
03 Bereiche/kUML/Beispiele/33 Blueprint – PdV Mitglieder-Journey.md) and is
rendered live below — the SVG is regenerated from this exact source on every
handbook build, so diagram and DSL source can never drift apart.
blueprint("PdV Mitglieder-Journey") {
    // ── Actors ──
    val interessent = actor("Interessent", ActorRole.CUSTOMER)
    val mitgliederbuero = actor("Mitgliederbüro", ActorRole.STAFF)
    val crm = actor("Mitglieder-CRM", ActorRole.SYSTEM)
    val landesverband = actor("Landesverband", ActorRole.PARTNER)

    // ── Channels ──
    val web = channel("pdv.de", ChannelKind.WEB)
    val social = channel("Social Media", ChannelKind.SOCIAL)
    val mailC = channel("E-Mail", ChannelKind.EMAIL)
    val personC = channel("Stammtisch", ChannelKind.IN_PERSON)

    // ── Touchpoints (declared before the phases, referenced by id) ──
    val socialPost = touchpoint("Social-Post", channel = social)
    val kampagne = touchpoint("Kampagne", channel = social)
    val programmSeite = touchpoint("Programm-Seite", channel = web)
    val newsletter = touchpoint("Newsletter-Anmeldung", channel = web)
    val onlineAntrag = touchpoint("Online-Antrag", channel = web)
    val bestaetigung = touchpoint("Bestätigungs-Mail", channel = mailC)
    val willkommensMail = touchpoint("Willkommens-Mail", channel = mailC)
    val ausweis = touchpoint("Mitgliedsausweis", channel = mailC)
    val stammtisch = touchpoint("Lokaler Stammtisch", channel = personC)
    val eventEinladung = touchpoint("Event-Einladung", channel = mailC)

    // ── Phase 1: Discovery ──
    phase("Entdeckung") {
        customer("Stößt auf PdV-Inhalt", Sentiment.NEUTRAL, touchpoints = listOf(socialPost))
        frontstage("Liefert Content & Werbung", actor = mitgliederbuero, touchpoints = listOf(kampagne))
        support("Trackt Reichweite", actor = crm)
    }

    // ── Phase 2: Expression of interest ──
    phase("Interessenbekundung") {
        customer("Besucht Website, liest Programm", Sentiment.POSITIVE, touchpoints = listOf(programmSeite))
        frontstage("Bietet Newsletter & Infomaterial", actor = mitgliederbuero, touchpoints = listOf(newsletter))
        backstage("Qualifiziert Lead", actor = mitgliederbuero)
        support("Speichert Interessent", actor = crm)
    }

    // ── Phase 3: Application ──
    phase("Antragstellung") {
        customer("Füllt Beitrittsantrag aus", Sentiment.NEUTRAL,
                 touchpoints = listOf(onlineAntrag), pain = "Formular wirkt lang")
        frontstage("Bestätigt Eingang", actor = mitgliederbuero, touchpoints = listOf(bestaetigung))
        backstage("Prüft Angaben & Beitrag", actor = mitgliederbuero)
        support("Legt Mitgliedsdatensatz an", actor = crm)
    }

    // ── Phase 4: Admission process (the "valley of tears") ──
    phase("Beitrittsprozess") {
        customer("Wartet auf Aufnahme", Sentiment.NEGATIVE, pain = "Unklar, wie lange es dauert")
        backstage("Beschließt Aufnahme im Vorstand", actor = mitgliederbuero)
        support("Weist Landesverband zu", actor = landesverband)
    }

    // ── Phase 5: Welcome ──
    phase("Willkommen") {
        customer("Erhält Willkommenspaket", Sentiment.VERY_POSITIVE, touchpoints = listOf(willkommensMail))
        frontstage("Versendet Willkommenspaket", actor = mitgliederbuero, touchpoints = listOf(ausweis))
        support("Aktiviert Mitgliederbereich", actor = crm)
    }

    // ── Phase 6: First engagement ──
    phase("Erstes Engagement") {
        customer("Nimmt am Stammtisch teil", Sentiment.VERY_POSITIVE, touchpoints = listOf(stammtisch))
        frontstage("Lädt zu Veranstaltungen ein", actor = landesverband, touchpoints = listOf(eventEinladung))
        backstage("Matcht Mitglied zu lokaler Gruppe", actor = landesverband)
    }

    blueprintDiagram("PdV Service Blueprint", emotionCurve = true)
}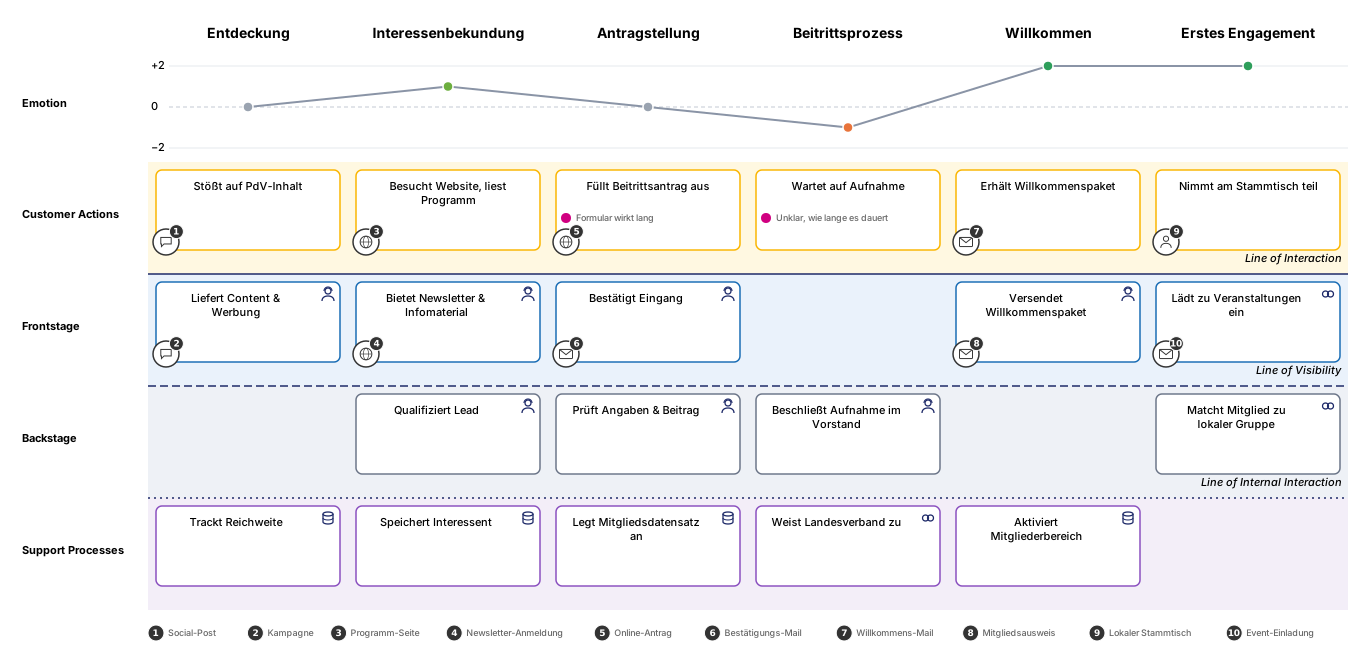
The rendered SVG shows six columns (phases) across four horizontal layers, the
three dividing lines, touchpoint symbols with channel icons, and an emotion
curve that dips from NEUTRAL/POSITIVE into a NEGATIVE valley during the
Phase-4 waiting period and climbs back up to VERY_POSITIVE — the classic
"valley of tears" narrative of membership onboarding.
Render it yourself with:
kuml render pdv-membership-journey.kuml.kts --format svgUser journey diagram (simplified view)
When you only need the customer lane — no frontstage / backstage / support layers —
use journeyDiagram instead of blueprintDiagram. The DSL is the same blueprint {}
container; only the closing call differs.
journeyDiagram renders a single-row timeline: phase columns, customer steps,
touchpoint icons, and the optional emotion curve. It is lighter and fits well in a
one-pager or presentation slide.
blueprint("PdV Mitglieder-Journey") {
    // ── Channels ──
    val web    = channel("pdv.de",       ChannelKind.WEB)
    val social = channel("Social Media", ChannelKind.SOCIAL)
    val mailC  = channel("E-Mail",       ChannelKind.EMAIL)
    val personC = channel("Stammtisch",  ChannelKind.IN_PERSON)

    // ── Touchpoints ──
    val socialPost   = touchpoint("Social-Post",        channel = social)
    val programmSeite = touchpoint("Programm-Seite",    channel = web)
    val onlineAntrag = touchpoint("Online-Antrag",      channel = web)
    val bestaetigung = touchpoint("Bestätigungs-Mail",  channel = mailC)
    val willkommensMail = touchpoint("Willkommens-Mail", channel = mailC)
    val ausweis      = touchpoint("Mitgliedsausweis",   channel = mailC)
    val stammtisch   = touchpoint("Lokaler Stammtisch", channel = personC)

    phase("Entdeckung") {
        customer("Stößt auf PdV-Inhalt", Sentiment.NEUTRAL,
                 touchpoints = listOf(socialPost))
    }
    phase("Interessenbekundung") {
        customer("Besucht Website, liest Programm", Sentiment.POSITIVE,
                 touchpoints = listOf(programmSeite))
    }
    phase("Antragstellung") {
        customer("Füllt Beitrittsantrag aus", Sentiment.NEUTRAL,
                 touchpoints = listOf(onlineAntrag, bestaetigung),
                 pain = "Formular wirkt lang")
    }
    phase("Beitrittsprozess") {
        customer("Wartet auf Aufnahme", Sentiment.NEGATIVE,
                 pain = "Unklar, wie lange es dauert")
    }
    phase("Willkommen") {
        customer("Erhält Willkommenspaket", Sentiment.VERY_POSITIVE,
                 touchpoints = listOf(willkommensMail, ausweis))
    }
    phase("Erstes Engagement") {
        customer("Nimmt am Stammtisch teil", Sentiment.VERY_POSITIVE,
                 touchpoints = listOf(stammtisch))
    }

    // journeyDiagram = single-row view; blueprintDiagram = 4-layer view
    journeyDiagram("PdV User Journey", emotionCurve = true)
}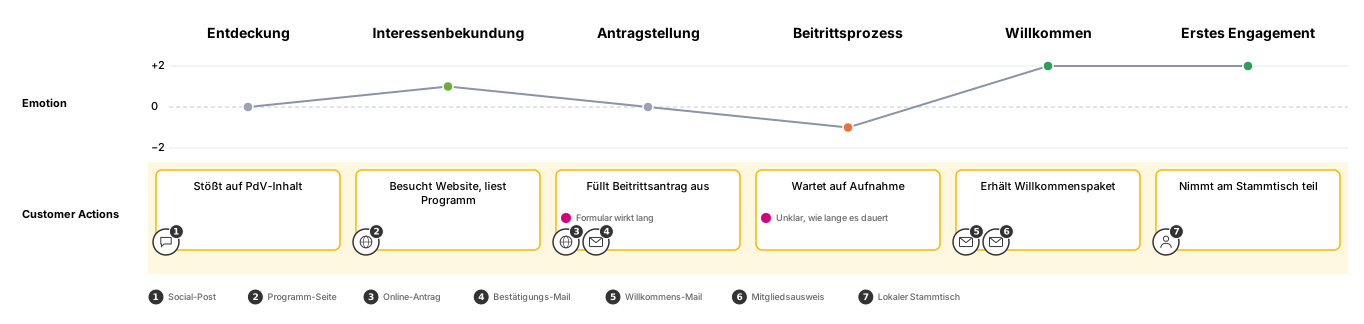
The emotionCurve = true flag overlays a spline through the Sentiment values —
a quick visual summary of where in the journey friction is highest.
Diagram type summary
| Call | Diagram type | Shows |
|---|---|---|
|
|
All four layers + dividing lines + phases |
|
|
Customer lane only + phases + optional emotion curve |
Both calls live inside the same blueprint { } container, so you can have both
diagram types in one script — one file, two SVG outputs.
Where to go from here
-
Core concepts — rendering pipeline and metamodel.
-
Simulate — execute state machines extracted from blueprints.
-
Pepela Thermostat showcase — an embedded systems showcase using the behaviour runtime.